Record First Quarter Revenue of $139 Million, and All-Time Quarterly Record Net Income of $21 Million, Adjusted EBITDA of $75 Million, and Free Cash Flow of $44 Million
Las Vegas – May 5, 2021 – Everi Holdings Inc. (NYSE: EVRI) (“Everi” or the “Company”), a premier provider of land-based and digital casino gaming content and products, financial technology, and loyalty solutions, today reported record financial results for the first quarter ended March 31, 2021. The 2021 first quarter results are a quarterly sequential improvement from the 2020 fourth quarter, and reflect the ongoing but reduced impact from the COVID-19 pandemic, as well as strong casino patron demand.
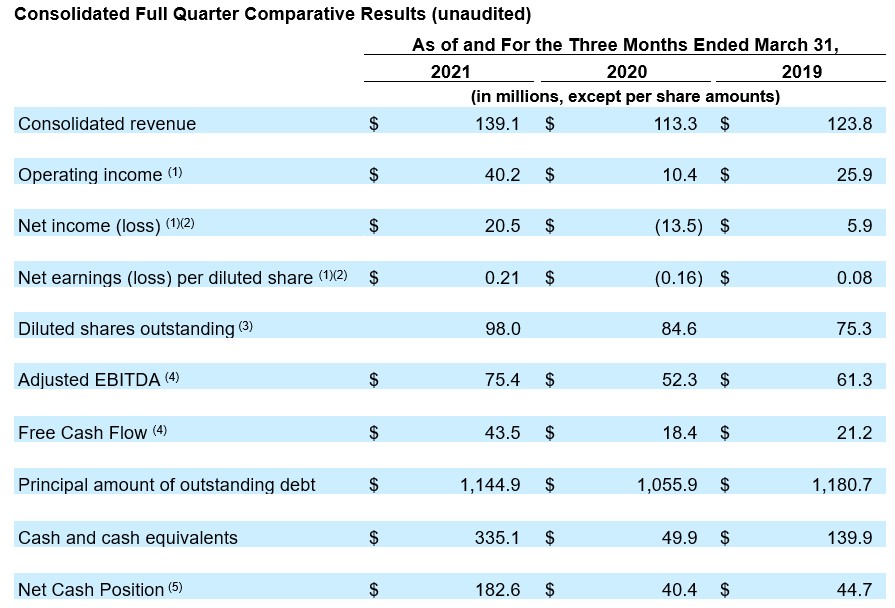
First Quarter 2021 Financial Results Highlights Compared to the First Quarter 2019
As the first quarter 2020 financial results reflect the onset of the COVID-19 pandemic, the Company believes a more meaningful comparison for the 2021 first quarter performance is the 2019 first quarter. The 2019 first quarter results were higher than the 2020 first quarter results. Financial results for the 2021, 2020, and 2019 first quarter periods are presented in the Consolidated and Games and Financial Technology Solutions highlight tables below.
- Revenues rose to a first quarter record $139.1 million compared to $123.8 million in the 2019 first quarter.
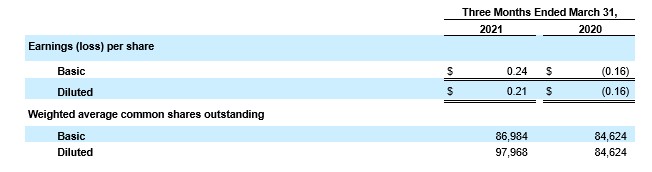
- Net income improved to a quarterly record $20.5 million, or $0.21 per diluted share, compared to $5.9 million, or $0.08 per diluted share, in the 2019 first quarter.
- Adjusted EBITDA, a non-GAAP financial measure, increased to a quarterly record $75.4 million compared to $61.3 million in the 2019 first quarter.
- Free Cash Flow, a non-GAAP financial measure, was $43.5 million compared to $21.2 million in the 2019 first quarter.
Michael Rumbolz, Chief Executive Officer of Everi, said, “We are off to a strong start in 2021 with first quarter record revenue; and all-time quarterly record net income, Adjusted EBITDA and Free Cash Flow. The substantial improvement in our operating results demonstrates the significant ongoing demand for our products in both our Games and FinTech segments. Our success in developing player-popular slot products and the industry attractiveness of our trusted financial and loyalty products are a direct reflection of our continued investment in the creation of new and enhanced products and services, as well as the talent and dedication of our entire Everi Team.
“Our Games segment momentum continues to reflect ongoing growth in our installed base of gaming operations units, in particular the consistent increases in placements of our higher-earning premium units that are helping to drive higher daily win per unit. We also believe that the ship share of our for-sale gaming units continues to expand. Our FinTech segment continues to benefit from our established leading share in the gaming FinTech market as well as strong demand for our newer loyalty products and services together with a high-level of interest in our cashless digital wallet solution. A key driver of the growth in our Games and FinTech business segments is our high-margin, recurring revenue streams, which we expect will help sustain our near- and long-term growth as the casino industry continues to recover.
“Importantly, our product momentum is translating into improvement in both our earnings and cash flow,” added Rumbolz. “This improvement enables us to continue to prudently invest in product innovation to sustain our growth, while also positioning Everi to return to our focus on reducing leverage. Our strong start to 2021, which has continued into the second quarter, is a great indication that we are already regaining our pre-pandemic momentum, including our expectation that 2021 full year results will exceed the levels achieved in 2019.”
(1) Operating income, net income, and net earnings per diluted share for the three months ended March 31, 2021, included $1.1 million in proceeds net of the associated legal fees related to a previous litigation settlement and $0.1 million in legal fees associated with the debt repricing. Operating income, net loss, and net loss per diluted share for the three months ended March 31, 2020, included $1.3 million of foreign exchange losses associated with the repatriation of foreign cash balances and $0.3 million of costs related to the purchase of certain assets from Micro Gaming Technology, Inc., which closed on December 24, 2019. Operating income, net income, and net loss per diluted share for the three months ended March 31, 2019, included $0.5 million of operating expense related to the acquisition of certain player loyalty assets and other non-recurring professional service fees.
(2) Net loss and net loss per diluted share for the three months ended March 31, 2020, included a $7.4 million pre-tax loss on extinguishment of debt associated with the early redemption and repurchase of unsecured notes.
(3) In December 2019, the Company completed a public offering of 11.5 million shares of common stock. Basic shares outstanding were 87.0 million, 84.6 million, and 70.3 million shares as of March 31, 2021, 2020, and 2019, respectively.
(4) For a reconciliation of net income (loss) to Adjusted EBITDA and Free Cash Flow, see the Unaudited Reconciliation of Net Income (Loss) to EBITDA and Adjusted EBITDA and to Free Cash Flow provided at the end of this release.
(5) For a reconciliation of Net Cash Position to Cash and Cash Equivalents, see the Unaudited Reconciliation of Cash and Cash Equivalents to Net Cash Position and Net Cash Available at the end of this release.
First Quarter 2021 Results Overview
Results for the three-month period ended March 31, 2021, reflect the continued impact of the COVID-19 pandemic, including certain casino closures and capacity limitations at reopened casinos; albeit to a lesser degree than any of the three preceding quarters. The 2021 first quarter results also reflect pent-up consumer demand as capacity limitations on casinos were reduced. First quarter 2020 results reflect the onset of the COVID-19 pandemic, while 2019 results were unimpacted by the pandemic.
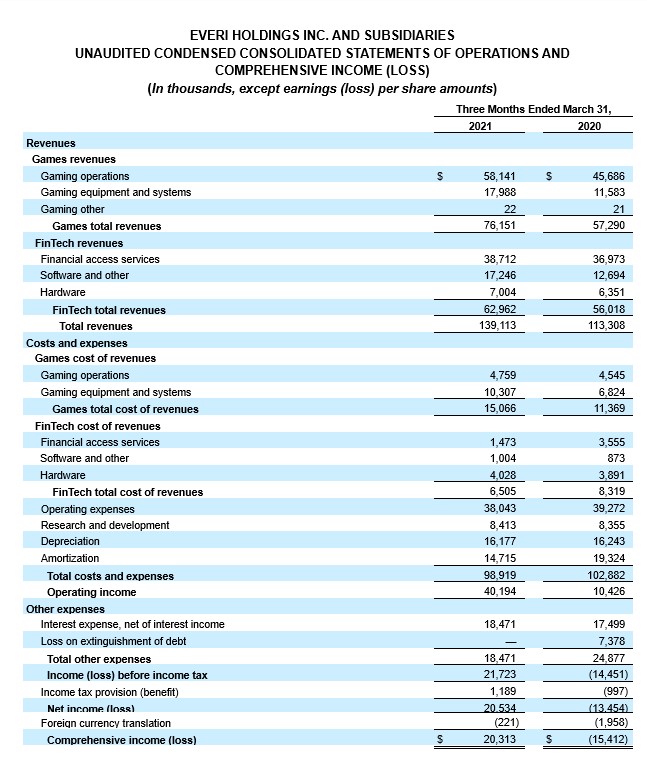
Revenues for the three-month period ended March 31, 2021 increased to $139.1 million compared to $113.3 million and $123.8 million in the first quarter of 2020 and 2019, respectively, driven by growth in both the Games and FinTech segments
Operating income for the 2021 first quarter increased to $40.2 million compared to $10.4 million and $25.9 million in the first quarter of 2020 and 2019, respectively. Net income was $20.5 million, or $0.21 per diluted share, compared with a net loss of $13.5 million, or $(0.16) per diluted share, in the first quarter of 2020, which included a $7.4 million pre-tax loss on extinguishment of debt, and net income of $5.9 million, or $0.08 per diluted share in 2019.
Adjusted EBITDA for the first quarter of 2021 was $75.4 million compared to $52.3 million and $61.3 million in the first quarter of 2020 and 2019, respectively.
(1) Operating loss for the three months ended March 31, 2020, included $0.1 million of foreign exchange losses associated with the repatriation of foreign cash balances. Operating income for the three months ended March 31, 2019, included the impact of $0.2 million related to certain non-operating professional fees.
(2) For a reconciliation of net income (loss) to Adjusted EBITDA, see the Unaudited Reconciliation of Net Income (Loss) to EBITDA and Adjusted EBITDA and to Free Cash Flow provided at the end of this release.
(3) Daily win per unit reflects the total of all units installed at casinos, inclusive of closed casinos and inactive units, where such units would have recorded no revenue and excludes the impact of the direct costs associated with the Company’s wide-area progressive jackpot expense.
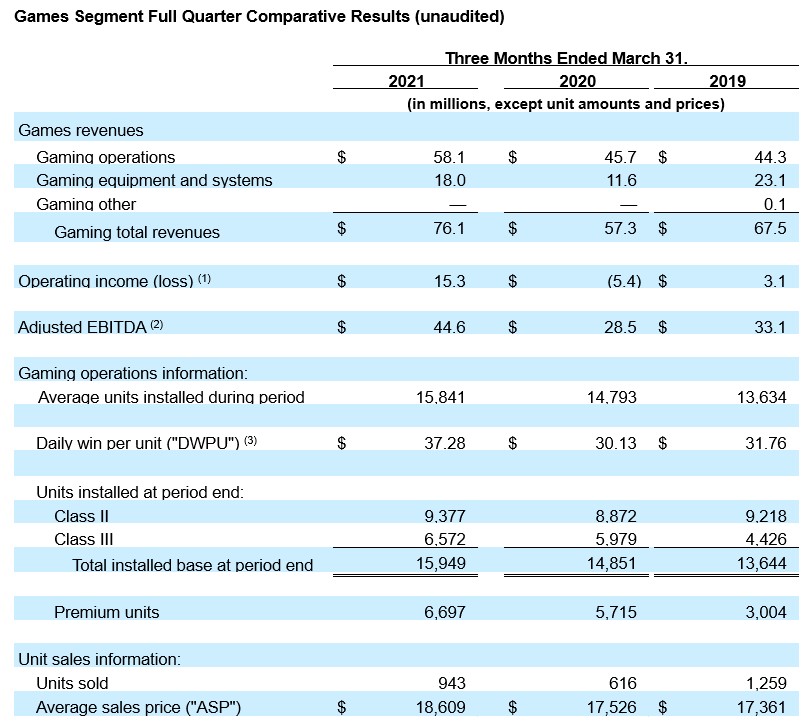
2021 First Quarter Games Segment Highlights
Games segment revenues increased to $76.1 million compared to $57.3 million and $67.5 million in the first quarter of 2020 and 2019, respectively, primarily reflecting strong gaming operations performance. While electronic gaming machine sales rose on a quarterly sequential basis, they continue to reflect casino operators’ capital conservation efforts to mitigate the impact of the COVID-19 pandemic.
Operating income increased to $15.3 million compared to a loss of $5.4 million a year ago and operating income of $3.1 million in the first quarter of 2019. The increase in 2021 first quarter operating income over the prior-year periods reflects the benefit of higher revenues and the Company’s cost containment efforts. Adjusted EBITDA increased to a quarterly record $44.6 million from $28.5 million and $33.1 million in the first quarter of 2020 and 2019, respectively.
- Gaming operations revenue, inclusive of the impact from casino closures and inactive units at open casinos (due to social distancing requirements), grew to a quarterly record $58.1 million compared to $45.7 million and $44.3 million in the first quarter of 2020 and 2019, respectively.
- Reflecting the player popularity of the latest games and growth in higher-earning premium unit placements, Daily Win per Unit (“DWPU”) for all units rose to a quarterly record $37.28 in the first quarter of 2021 compared to $30.13 and $31.76 in the first quarter of 2020 and 2019, respectively. Included in the calculation of DWPU for the first quarter of 2021 and 2020 are units in closed casinos and installed units that were inactive in casinos due to social distancing requirements that earned no revenue during the period.
- The installed base as of March 31, 2021 increased by 7%, or 1,098 units, year over year and by 204 units on a quarterly sequential basis to a record 15,949 units. The installed base for all three periods includes all units, whether or not casinos were open and whether or not the games were active.
- In April, gaming regulators in Nevada and New Jersey approved the Company’s wide-area progressive link, enabling the first WAP units on the Empire DCX® cabinet with The Mask® and The Karate Kid® themes to be installed in commercial casinos.
- Digital revenue more than doubled to $2.4 million in the first quarter of 2021 compared to $1.1 million a year ago. Digital revenue growth reflects increased B2B revenue from the Company’s expanded base of iGaming operator sites featuring its games, including sites in Michigan which went live in January, together with a growing library of available slot content. The B2B revenue increase more than offset a decline in B2C revenue as the Company continues to de-emphasize the B2C portion of its Digital gaming operations.
- Revenues from the New York Lottery system business were $4.8 million in the first quarter of 2021 compared to $4.8 million and $4.7 million in the first quarter of 2020 and 2019, respectively.
- Gaming equipment and systems revenues generated from the sale of gaming units and other related parts and equipment totaled $18.0 million in the first quarter of 2021 compared to $11.6 million and $23.1 million in the first quarter of 2020 and 2019, respectively.
- The Company sold 943 units at an average selling price (“ASP”) of $18,609 in the first quarter of 2021 compared with 616 units at an ASP of $17,526 in the first quarter of 2020 and 1,259 units at an ASP of $17,361 in the first quarter of 2019.
(1) Operating income for the three months ended March 31, 2021, included $1.1 million in proceeds net of the associated legal fees related to a previous litigation settlement and $0.1 million in legal fees associated with the debt repricing. Operating income for the three months ended March 31, 2020, included $1.2 million of foreign exchange losses associated with the repatriation of foreign cash balances and $0.3 million of costs related to the purchase of certain assets from Micro Gaming Technology, Inc., which closed on December 24, 2019. Operating income for the three months ended March 31, 2019, included $0.3 million of operating expense related to the acquisition of certain player loyalty assets and other non-recurring professional service fees.
(2) For a reconciliation of net income (loss) to Adjusted EBITDA, see the Unaudited Reconciliation of Net Income (Loss) to EBITDA and Adjusted EBITDA and to Free Cash Flow provided at the end of this release.
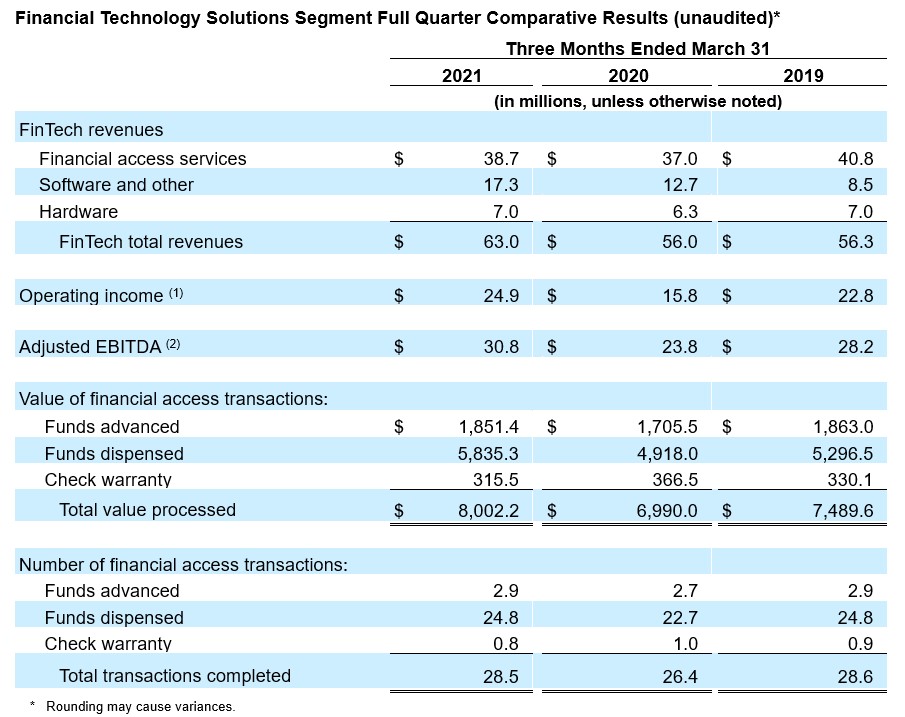
2021 First Quarter Financial Technology Solutions Segment Highlights
Notwithstanding the ongoing impact of certain casino closures and reduced casino activity due to the COVID-19 pandemic, the 2021 first quarter FinTech revenues increased to $63.0 million compared to $56.0 million and $56.3 million in the first quarter of 2020 and 2019, respectively. The growth over both years primarily reflects an increase in software and other revenues and lower-margin hardware sales, partially offset when compared to 2019 by a decrease in higher-margin financial access service revenues.
Operating income of $24.9 million compares to $15.8 million and $22.8 million in the first quarter of 2020 and 2019, respectively. The increase in operating income reflects the benefit of higher revenues partially offset by an increase in research and development expense driven by an acceleration of new product development efforts, including new and enhanced loyalty products and the Company’s CashClub Wallet digital technology offering. Adjusted EBITDA was $30.8 million compared to $23.8 million and $28.2 million in the first quarter of 2020 and 2019, respectively.
- Financial access services revenues, which include both cashless and cash dispensing debit and credit card transactions and check services, increased on a quarterly sequential basis to $38.7 million from $31.1 million in the fourth quarter of 2020, reflecting continued improvements in casino activity. While such revenues increased from $37.0 million in the first quarter of 2020, they declined compared to $40.8 million in the first quarter of 2019, reflecting the impact of closed casinos and lower casino activity on the Company’s broad customer base.
- On a same-store sales basis, transactional activity decreased slightly compared to the 2019 first quarter; however, activity rose each month during the 2021 first quarter with activity in March 2021 slightly ahead of the activity generated in March 2019.
- Software and other revenues, which includes loyalty and regulatory compliance software, product subscriptions, kiosk maintenance services, and other revenue, were $17.3 million, of which approximately 72% were of a recurring nature, compared to total revenue of $12.7 million in the first quarter of 2020, of which 79% were of a recurring nature, and $8.5 million in the first quarter of 2019, of which 85% were of a recurring nature.
- Revenues from loyalty software and product subscriptions increased on a year-over-year basis, as did revenues from kiosk maintenance services and regulatory compliance software and products.
- Hardware sales revenues were $7.0 million in the first quarter of 2021 compared to $6.3 million and $7.0 million in the first quarter of 2020 and 2019, respectively.
Balance Sheet and Liquidity
- As of March 31, 2021, the Company had cash and cash equivalents of $335.1 million and a Net Cash Position of $182.6 million.
- During the 2021 first quarter, the Company repriced $735.5 million of its Senior Secured Term Loan, reducing the applicable interest rate by 25 basis points, and driving cash interest cost savings of approximately $1.8 million on an annualized basis at current market rates.
- In the 2021 first quarter, the Company made its final payment, exclusive of any earned contingent consideration, for its 2019 acquisition of certain player loyalty assets of Atrient for a total of $10 million.
- During the 2021 second quarter, the Company expects to fund up to $10 million for the earned contingent consideration for its 2019 acquisition of certain player loyalty assets of Atrient and approximately $5 million for the final installment payment related to the 2019 MGT assets acquisition.
Outlook
Everi expects 2021 second quarter operating and financial results will be comparable to or slightly lower than the Company’s 2021 first quarter results; and expects that results in the second half of 2021 will continue to exceed the then-record Adjusted EBITDA levels achieved in the second half of 2019, barring any macro-economic or pandemic-related setback.
Investor Conference Call and Webcast
The Company will host an investor conference call to discuss its 2021 first quarter results at 5:00 p.m. ET today. The conference call may be accessed live by phone by dialing (631) 891-4304. A replay of the call will be available beginning at 8:00 p.m. ET today and may be accessed by dialing +1 (412) 317-6671; the PIN number is 10014357. A replay will be available until May 12, 2021. The call will be webcast live and archived on dev.everi.workhorsewebit.com (select “Investors” followed by “Events & Presentations”).
Non-GAAP Financial Information
In order to enhance investor understanding of the underlying trends in our business, our cash balance and cash available for our operating needs, and to provide for better comparability between periods in different years, we are providing in this press release Adjusted EBITDA, Free Cash Flow, Net Cash Position and Net Cash Available, which are not measures of our financial performance or position under United States Generally Accepted Accounting Principles (“GAAP”). Accordingly, Adjusted EBITDA, and Free Cash Flow should not be considered in isolation or as a substitute for measures prepared in accordance with GAAP. These measures should be read in conjunction with our net earnings, operating income, and cash flow data prepared in accordance with GAAP. With respect to Net Cash Position and Net Cash Available, these measures should be read in conjunction with cash and cash equivalents prepared in accordance with GAAP.
We define Adjusted EBITDA as earnings (loss) before interest, taxes, depreciation and amortization, loss on extinguishment of debt, non-cash stock compensation expense, accretion of contract rights, litigation settlement received net of legal costs, foreign exchange loss, asset acquisition expense, non-recurring professional fees, and other one-time charges. We present Adjusted EBITDA as we use this measure to manage our business and consider this measure to be supplemental to our operating performance. We also make certain compensation decisions based, in part, on our operating performance, as measured by Adjusted EBITDA; and our current credit facility and existing senior unsecured notes require us to comply with a consolidated secured leverage ratio that includes performance metrics substantially similar to Adjusted EBITDA.
We define Free Cash Flow as Adjusted EBITDA less cash paid for interest, cash paid for capital expenditures, cash paid for placement fees, and cash paid for taxes net of refunds. We present Free Cash Flow as a measure of performance and believe it provides investors with another indicator of our operating performance. It should not be inferred that the entire Free Cash Flow amount is available for discretionary expenditures.
A reconciliation of the Company’s net income (loss) per GAAP to Adjusted EBITDA and Free Cash Flow is included in the Unaudited Reconciliation of Net Income (Loss) to EBITDA and Adjusted EBITDA and to Free Cash Flow provided at the end of this release. Additionally, a reconciliation of each segment’s operating income to EBITDA and Adjusted EBITDA is also included. On a segment level, operating income per GAAP, rather than net earnings per GAAP, is reconciled to EBITDA and Adjusted EBITDA as the Company does not report net earnings by segment. Management believes that this presentation is meaningful to investors in evaluating the performance of the Company’s segments.
We define (i) Net Cash Position as cash and cash equivalents plus settlement receivables less settlement liabilities and (ii) Net Cash Available as Net Cash Position plus undrawn amounts available under our revolving credit facility. We present Net Cash Position because our cash position, as measured by cash and cash equivalents, depends upon changes in settlement receivables and the timing of payments related to settlement liabilities. As such, our cash and cash equivalents can change substantially based upon the timing of our receipt of payments for settlement receivables and payments we make to customers for our settlement liabilities. We present Net Cash Available as management monitors this amount in connection with its forecasting of cash flows and future cash requirements.
A reconciliation of the Company’s cash and cash equivalents per GAAP to Net Cash Position and Net Cash Available is included in the Unaudited Reconciliation of Cash and Cash Equivalents to Net Cash Position and Net Cash Available provided at the end of this release.
Cautionary Note Regarding Forward-Looking Statements
This press release contains “forward-looking statements” as defined in the U.S. Private Securities Litigation Reform Act of 1995. In this context, forward-looking statements often address our expected future business and financial performance, and often contain words such as “goal,” “target,” “indication,” “future,” “estimate,” “expect,” “anticipate,” “intend,” “plan,” “believe,” “seek,” “project,” “may,” “should,” “designed to,” “in an effort to,” “will provide,” “look forward to,” or “will” and similar expressions to identify forward-looking statements. These statements are based upon management’s current expectations, assumptions and estimates and are not guarantees of timing, future events or performance. Actual results may differ materially from those contemplated in these statements, due to risks and uncertainties. Examples of forward-looking statements include, among others, statements regarding our ability to execute on key initiatives and deliver ongoing operating and financial improvements; regain revenue momentum; sustain our overall growth; generate Free Cash Flow; improve the Company’s capital structure; drive growth of the gaming operations installed base and DWPU; continue expanding the portions of the gaming floor the Company’s games address; successfully perform obligations required by acquisition agreements; and create incremental value for our shareholders, as well as statements regarding our expectations for the industry environment and the adoption of our products and technologies.
Forward-looking statements are neither historical facts nor assurances of future performance. Instead, they are based only on our current beliefs, expectations, and assumptions regarding the future of our business, future plans and strategies, projections, anticipated events and trends, the economy and other future conditions. Because forward-looking statements relate to the future, they are subject to inherent risks, uncertainties and changes in circumstances that are often difficult to predict and many of which are beyond our control. Our actual results and financial condition may differ materially from those indicated in forward-looking statements. Important factors that could cause our actual results and financial condition to differ materially from those indicated in the forward-looking statements include, without limitation, the impact of the ongoing COVID-19 global pandemic on our business, operations and financial condition, our history of net losses and our ability to generate profits in the future; our debt leverage and the related covenants that restrict our operations; our ability to generate sufficient cash to service all of our indebtedness, fund working capital, and capital expenditures; our ability to withstand unanticipated impacts of a pandemic outbreak of uncertain duration; our ability to withstand the loss of revenue during the closure of our customers’ facilities; our ability to maintain our current customers; our ability to compete in the gaming industry; our ability to execute on mergers, acquisitions and/or strategic alliances, including the timing and closing of acquisitions and our ability to integrate and operate such acquisitions consistent with our forecasts; our ability to access the capital markets to raise funds; expectations regarding our existing and future installed base and win per day; expectations regarding development and placement fee arrangements; inaccuracies in underlying operating assumptions; expectations regarding customers’ preferences and demands for future gaming offerings; expectations regarding our product portfolio; the overall growth of the gaming industry, if any; our ability to replace revenue associated with terminated customer contracts; margin degradation from contract renewals; technological obsolescence; our ability to comply with the Europay, MasterCard and Visa global standard for cards equipped with security chip technology; our ability to introduce new and enhanced products and services, including third-party licensed content; gaming establishment and patron preferences; our ability to prevent, mitigate or timely recover from cybersecurity breaches, attacks and compromises; the level of our capital expenditures and product development; anticipated sales performance; employee turnover; national and international economic conditions; changes in global market, business and regulatory conditions arising as a result of the COVID-19 global pandemic; changes in gaming regulatory, card association and statutory requirements; regulatory and licensing difficulties that we may face; competitive pressures in the gaming and financial technology sectors; the impact of changes to tax laws; uncertainty of litigation outcomes; interest rate fluctuations; unanticipated expenses or capital needs and those other risks and uncertainties discussed in our most recent Annual Report on Form 10-K filed with the U.S. Securities and Exchange Commission on March 15, 2021. Given these risks and uncertainties, there can be no assurance that the forward-looking information contained in this press release will in fact transpire or prove to be accurate. Readers are cautioned not to place undue reliance on the forward-looking statements contained herein, which are based only on information currently available to us and speak only as of the date hereof.
This press release should be read in conjunction with our Annual Report on Form 10-K for the year ended December 31, 2020, and with the information included in our other press releases, reports and other filings with the SEC. Understanding the information contained in these filings is important in order to fully understand our reported financial results and our business outlook for future periods.
Contacts:
Media Relations
Dona Cassese
VP, Marketing
(702) 556-7133 or [email protected]
Investor Relations
William Pfund
SVP, Investor Relations
(702) 676-9513 or [email protected]
JCIR
Richard Land, James Leahy
(212) 835-8500 or [email protected]